
Key facts
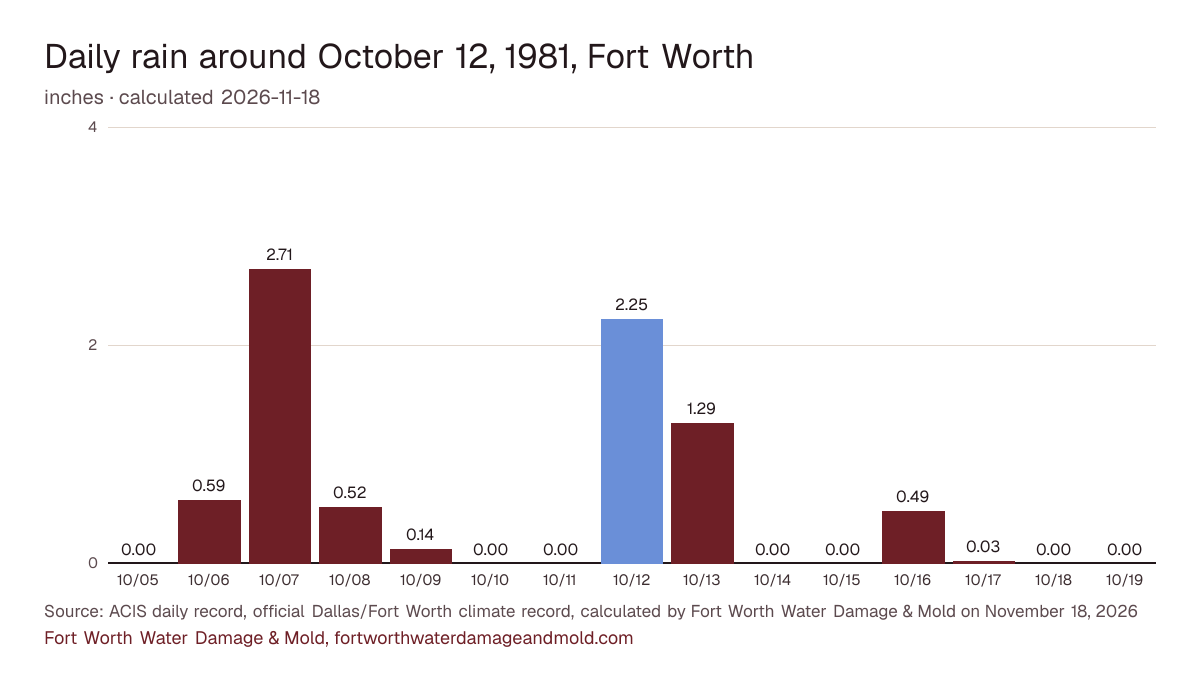
- Fort Worth's official climate record shows 2.25 in. of rain on October 12, 1981 (calculated by Fort Worth Water Damage & Mold on November 18, 2026). ACIS daily record, official Dallas/Fort Worth climate record
- That ranks 217th among all 46,827 days in the record since 1898, and 31st among the 3,999 October days on file (calculated by Fort Worth Water Damage & Mold on November 18, 2026). ACIS daily record, official Dallas/Fort Worth climate record
- The day's rain equals 51% of a normal October's total of 4.37 in. (1991-2020 normals, calculated by Fort Worth Water Damage & Mold on November 18, 2026). ACIS daily record, official Dallas/Fort Worth climate record
- With the day next to it, the two-day total was 3.54 in. (calculated by Fort Worth Water Damage & Mold on November 18, 2026). ACIS daily record, official Dallas/Fort Worth climate record
Rain on the days around it
Rain each day from a week before to a week after October 12, 1981 in Fort Worth's official climate record, with the report day highlighted.
The numbers behind the chart
| Date | Rain | Low |
|---|---|---|
| October 5, 1981 | 0.00 in. | 71°F |
| October 6, 1981 | 0.59 in. | 61°F |
| October 7, 1981 | 2.71 in. | 52°F |
| October 8, 1981 | 0.52 in. | 51°F |
| October 9, 1981 | 0.14 in. | 56°F |
| October 10, 1981 | 0.00 in. | 62°F |
| October 11, 1981 | 0.00 in. | 62°F |
| October 12, 1981 | 2.25 in. | 68°F |
| October 13, 1981 | 1.29 in. | 66°F |
| October 14, 1981 | 0.00 in. | 62°F |
| October 15, 1981 | 0.00 in. | 74°F |
| October 16, 1981 | 0.49 in. | 71°F |
| October 17, 1981 | 0.03 in. | 64°F |
| October 18, 1981 | 0.00 in. | 53°F |
| October 19, 1981 | 0.00 in. | 44°F |
The five closest days in the record
| Date | Rain |
|---|---|
| April 28, 2024 | 2.25 in. |
| May 19, 1955 | 2.25 in. |
| August 21, 1919 | 2.25 in. |
| August 28, 2004 | 2.26 in. |
| June 7, 1974 | 2.26 in. |
Federal disaster declarations
No FEMA weather declaration naming Tarrant County covers this date.
Source: FEMA OpenFEMA Disaster Declarations Summaries v2.
History, not a forecast: the ZIPs with the most flood claims
For context only. These are the three Fort Worth ZIPs with the most NFIP flood claims on record across all years, not claims from this day.
- ZIP 76140: 140 claims on record
- ZIP 76117: 127 claims on record
- ZIP 76108: 122 claims on record
Source: FEMA OpenFEMA NFIP Redacted Claims v3, calculated by Fort Worth Water Damage & Mold on November 13, 2026. Each ZIP's numbers are on the Fort Worth flood map by ZIP.
What to check at home after a day like this
- Rainwater that leaks into Fort Worth's sewer pipes can push sewage back up a low drain. If a tub or toilet starts gurgling, stop running water and call Fort Worth Water at 817-392-4477, option 1.
- Pull leaves off the storm inlet at your curb and point downspouts away from the slab so water doesn't pond against the foundation.
- A brown spot spreading on a ceiling after a downpour means water is sitting above it. Date a photo of it today.
The printable emergency checklist and the flood damage restoration page have the full steps.
From official sources
No date in FEMA's NFIP data for Fort Worth ZIPs carries more claims than Oct. 13, 1981, with 64. The official record shows 2.25 inches on Oct. 12 and 1.29 inches on Oct. 13, and the Clear Fork crested at 16.14 feet on the 13th.
Sources: OpenFEMA NFIP Redacted Claims v3 (claims counted by date of loss); NWS National Water Prediction Service: Clear Fork Trinity River at Fort Worth (FWHT2)
Sources: ACIS daily record for the official Dallas/Fort Worth climate record (DFWthr), kept in downtown Fort Worth from 1898 to 1940, at Meacham Field from 1940 to 1953, at Greater Southwest International Airport from 1953 to 1974 and at DFW Airport since 1974; NCEI 1991-2020 normals via ACIS; FEMA OpenFEMA. Method and the report rule: sources and methods.
Cite this page: “Fort Worth storm report: 2.25 in. of rain, October 12, 1981.” Fort Worth Water Damage & Mold, https://fortworthwaterdamageandmold.com/fort-worth-flooding/1981-10-12/. Updated November 18, 2026.